
Machine-learning tool gives doctors a more detailed 3D picture of fetal health

For pregnant women, ultrasounds are an informative (and sometimes necessary) procedure. They typically produce two-dimensional black-and-white scans of fetuses that can reveal key insights, including biological sex, approximate size, and abnormalities like heart issues or cleft lip. If your doctor wants a closer look, they may use magnetic resonance imaging (MRI), which uses magnetic fields to capture images that can be combined to create a 3D view of the fetus.

MRIs aren’t a catch-all, though; the 3D scans are difficult for doctors to interpret well enough to diagnose problems because our visual system is not accustomed to processing 3D volumetric scans (in other words, a wrap-around look that also shows us the inner structures of a subject). Enter machine learning, which could help model a fetus’s development more clearly and accurately from data — although no such algorithm has been able to model their somewhat random movements and various body shapes.

That is, until a new approach called “Fetal SMPL” from MIT’s Computer Science and Artificial Intelligence Laboratory (CSAIL), Boston Children’s Hospital (BCH), and Harvard Medical School presented clinicians with a more detailed picture of fetal health. It was adapted from “SMPL” (Skinned Multi-Person Linear model), a 3D model developed in computer graphics to capture adult body shapes and poses, as a way to represent fetal body shapes and poses accurately. Fetal SMPL was then trained on 20,000 MRI volumes to predict the location and size of a fetus and create sculpture-like 3D representations. Inside each model is a skeleton with 23 articulated joints called a “kinematic tree,” which the system uses to pose and move like the fetuses it saw during training.

The extensive, real-world scans that Fetal SMPL learned from helped it develop pinpoint accuracy. Imagine stepping into a stranger’s footprint while blindfolded, and not only does it fit perfectly, but you correctly guess what shoe they wore — similarly, the tool closely matched the position and size of fetuses in MRI frames it hadn’t seen before. Fetal SMPL was only misaligned by an average of about 3.1 millimeters, a gap smaller than a single grain of rice.

The approach could enable doctors to precisely measure things like the size of a baby’s head or abdomen and compare these metrics with healthy fetuses at the same age. Fetal SMPL has demonstrated its clinical potential in early tests, where it achieved accurate alignment results on a small group of real-world scans.

“It can be challenging to estimate the shape and pose of a fetus because they’re crammed into the tight confines of the uterus,” says lead author, MIT PhD student, and CSAIL researcher Yingcheng Liu SM ’21. “Our approach overcomes this challenge using a system of interconnected bones under the surface of the 3D model, which represent the fetal body and its motions realistically. Then, it relies on a coordinate descent algorithm to make a prediction, essentially alternating between guessing pose and shape from tricky data until it finds a reliable estimate.”

In utero

Fetal SMPL was tested on shape and pose accuracy against the closest baseline the researchers could find: a system that models infant growth called “SMIL.” Since babies out of the womb are larger than fetuses, the team shrank those models by 75 percent to level the playing field.

The system outperformed this baseline on a dataset of fetal MRIs between the gestational ages of 24 and 37 weeks taken at Boston Children’s Hospital. Fetal SMPL was able to recreate real scans more precisely, as its models closely lined up with real MRIs.

The method was efficient at lining up their models to images, only needing three iterations to arrive at a reasonable alignment. In an experiment that counted how many incorrect guesses Fetal SMPL had made before arriving at a final estimate, its accuracy plateaued from the fourth step onward.

The researchers have just begun testing their system in the real world, where it produced similarly accurate models in initial clinical tests. While these results are promising, the team notes that they’ll need to apply their results to larger populations, different gestational ages, and a variety of disease cases to better understand the system’s capabilities.

Only skin deep

Liu also notes that their system only helps analyze what doctors can see on the surface of a fetus, since only bone-like structures lie beneath the skin of the models. To better monitor babies’ internal health, such as liver, lung, and muscle development, the team intends to make their tool volumetric, modeling the fetus’s inner anatomy from scans. Such upgrades would make the models more human-like, but the current version of Fetal SMPL already presents a precise (and unique) upgrade to 3D fetal health analysis.

“This study introduces a method specifically designed for fetal MRI that effectively captures fetal movements, enhancing the assessment of fetal development and health,” says Kiho Im, Harvard Medical School associate professor of pediatrics and staff scientist in the Division of Newborn Medicine at BCH’s Fetal-Neonatal Neuroimaging and Developmental Science Center. Im, who was not involved with the paper, adds that this approach “will not only improve the diagnostic utility of fetal MRI, but also provide insights into the early functional development of the fetal brain in relation to body movements.”

“This work reaches a pioneering milestone by extending parametric surface human body models for the earliest shapes of human life: fetuses,” says Sergi Pujades, an associate professor at University Grenoble Alpes, who wasn’t involved in the research. “It allows us to detangle the shape and motion of a human, which has already proven to be key in understanding how adult body shape relates to metabolic conditions and how infant motion relates to neurodevelopmental disorders. In addition, the fact that the fetal model stems from, and is compatible with, the adult (SMPL) and infant (SMIL) body models, will allow us to study human shape and pose evolution over long periods of time. This is an unprecedented opportunity to further quantify how human shape growth and motion are affected by different conditions.”

Liu wrote the paper with three CSAIL members: Peiqi Wang SM ’22, PhD ’25; MIT PhD student Sebastian Diaz; and senior author Polina Golland, the Sunlin and Priscilla Chou Professor of Electrical Engineering and Computer Science, a principal investigator in MIT CSAIL, and the leader of the Medical Vision Group. BCH assistant professor of pediatrics Esra Abaci Turk, Inria researcher Benjamin Billot, and Harvard Medical School professor of pediatrics and professor of radiology Patricia Ellen Grant are also authors on the paper. This work was supported, in part, by the National Institutes of Health and the MIT CSAIL-Wistron Program.

The researchers will present their work at the International Conference on Medical Image Computing and Computer Assisted Intervention (MICCAI) in September.


How to build AI scaling laws for efficient LLM training and budget maximization

When researchers are building large language models (LLMs), they aim to maximize performance under a particular computational and financial budget. Since training a model can amount to millions of dollars, developers need to be judicious with cost-impacting decisions about, for instance, the model architecture, optimizers, and training datasets before committing to a model. To anticipate the quality and accuracy of a large model’s predictions, practitioners often turn to scaling laws: using smaller, cheaper models to try to approximate the performance of a much larger target model. The challenge, however, is that there are thousands of ways to create a scaling law.

New work from MIT and MIT-IBM Watson AI Lab researchers addresses this by amassing and releasing a collection of hundreds of models and metrics concerning training and performance to approximate more than a thousand scaling laws. From this, the team developed a meta-analysis and guide for how to select small models and estimate scaling laws for different LLM model families, so that the budget is optimally applied toward generating reliable performance predictions.

“The notion that you might want to try to build mathematical models of the training process is a couple of years old, but I think what was new here is that most of the work that people had been doing before is saying, ‘can we say something post-hoc about what happened when we trained all of these models, so that when we’re trying to figure out how to train a new large-scale model, we can make the best decisions about how to use our compute budget?’” says Jacob Andreas, associate professor in the Department of Electrical Engineering and Computer Science and principal investigator with the MIT-IBM Watson AI Lab.

The research was recently presented at the International Conference on Machine Learning by Andreas, along with MIT-IBM Watson AI Lab researchers Leshem Choshen and Yang Zhang of IBM Research.

Extrapolating performance

No matter how you slice it, developing LLMs is an expensive endeavor: from decision-making regarding the numbers of parameters and tokens, data selection and size, and training techniques to determining output accuracy and tuning to the target applications and tasks. Scaling laws offer a way to forecast model behavior by relating a large model’s loss to the performance of smaller, less-costly models from the same family, avoiding the need to fully train every candidate. Mainly, the differences between the smaller models are the number of parameters and token training size. According to Choshen, elucidating scaling laws not only enable better pre-training decisions, but also democratize the field by enabling researchers without vast resources to understand and build effective scaling laws.

The functional form of scaling laws is relatively simple, incorporating components from the small models that capture the number of parameters and their scaling effect, the number of training tokens and their scaling effect, and the baseline performance for the model family of interest. Together, they help researchers estimate a target large model’s performance loss; the smaller the loss, the better the target model’s outputs are likely to be.

These laws allow research teams to weigh trade-offs efficiently and to test how best to allocate limited resources. They’re particularly useful for evaluating scaling of a certain variable, like the number of tokens, and for A/B testing of different pre-training setups.

In general, scaling laws aren’t new; however, in the field of AI, they emerged as models grew and costs skyrocketed. “It’s like scaling laws just appeared at some point in the field,” says Choshen. “They started getting attention, but no one really tested how good they are and what you need to do to make a good scaling law.” Further, scaling laws were themselves also a black box, in a sense. “Whenever people have created scaling laws in the past, it has always just been one model, or one model family, and one dataset, and one developer,” says Andreas. “There hadn’t really been a lot of systematic meta-analysis, as everybody is individually training their own scaling laws. So, [we wanted to know,] are there high-level trends that you see across those things?”

Building better

To investigate this, Choshen, Andreas, and Zhang created a large dataset. They collected LLMs from 40 model families, including Pythia, OPT, OLMO, LLaMA, Bloom, T5-Pile, ModuleFormer mixture-of-experts, GPT, and other families. These included 485 unique, pre-trained models, and where available, data about their training checkpoints, computational cost (FLOPs), training epochs, and the seed, along with 1.9 million performance metrics of loss and downstream tasks. The models differed in their architectures, weights, and so on. Using these models, the researchers fit over 1,000 scaling laws and compared their accuracy across architectures, model sizes, and training regimes, as well as testing how the number of models, inclusion of intermediate training checkpoints, and partial training impacted the predictive power of scaling laws to target models. They used measurements of absolute relative error (ARE); this is the difference between the scaling law’s prediction and the observed loss of a large, trained model. With this, the team compared the scaling laws, and after analysis, distilled practical recommendations for AI practitioners about what makes effective scaling laws.

Their shared guidelines walk the developer through steps and options to consider and expectations. First, it’s critical to decide on a compute budget and target model accuracy. The team found that 4 percent ARE is about the best achievable accuracy one could expect due to random seed noise, but up to 20 percent ARE is still useful for decision-making. The researchers identified several factors that improve predictions, like including intermediate training checkpoints, rather than relying only on final losses; this made scaling laws more reliable. However, very early training data before 10 billion tokens are noisy, reduce accuracy, and should be discarded. They recommend prioritizing training more models across a spread of sizes to improve robustness of the scaling law’s prediction, not just larger models; selecting five models provides a solid starting point. 

Generally, including larger models improves prediction, but costs can be saved by partially training the target model to about 30 percent of its dataset and using that for extrapolation. If the budget is considerably constrained, developers should consider training one smaller model within the target model family and borrow scaling law parameters from a model family with similar architecture; however, this may not work for encoder–decoder models. Lastly, the MIT-IBM research group found that when scaling laws were compared across model families, there was strong correlation between two sets of hyperparameters, meaning that three of the five hyperparameters explained nearly all of the variation and could likely capture the model behavior. Together, these guidelines provide a systematic approach to making scaling law estimation more efficient, reliable, and accessible for AI researchers working under varying budget constraints.

Several surprises arose during this work: small models partially trained are still very predictive, and further, the intermediate training stages from a fully trained model can be used (as if they are individual models) for prediction of another target model. “Basically, you don’t pay anything in the training, because you already trained the full model, so the half-trained model, for instance, is just a byproduct of what you did,” says Choshen. Another feature Andreas pointed out was that, when aggregated, the variability across model families and different experiments jumped out and was noisier than expected. Unexpectedly, the researchers found that it’s possible to utilize the scaling laws on large models to predict performance down to smaller models. Other research in the field has hypothesized that smaller models were a “different beast” compared to large ones; however, Choshen disagrees. “If they’re totally different, they should have shown totally different behavior, and they don’t.”

While this work focused on model training time, the researchers plan to extend their analysis to model inference. Andreas says it’s not, “how does my model get better as I add more training data or more parameters, but instead as I let it think for longer, draw more samples. I think there are definitely lessons to be learned here about how to also build predictive models of how much thinking you need to do at run time.” He says the theory of inference time scaling laws might become even more critical because, “it’s not like I’m going to train one model and then be done. [Rather,] it’s every time a user comes to me, they’re going to have a new query, and I need to figure out how hard [my model needs] to think to come up with the best answer. So, being able to build those kinds of predictive models, like we’re doing in this paper, is even more important.”

This research was supported, in part, by the MIT-IBM Watson AI Lab and a Sloan Research Fellowship. 

2025-26 EECS Faculty Award Roundup

This ongoing listing of awards and recognitions won by our faculty is added to all year, beginning in September.

Hal Abelson, Class of 1922 Professor, was the recipient of the 2025 Lifetime Achievement Award for Excellence by Open Education Global.

Ahmad Bahai, Professor of the Practice, was elected to the AIMBE College of Fellows Class of 2025.

Ahmad Bahai, Professor of the Practice, was elected to the 2025 cohort of Fellows by the National Academy of Inventors.

Marc Baldo, the Dugald C. Jackson Professor, was elected to the 2025-27 Committed to Caring cohort.

Pulkit Agrawal, Associate Professor, was awarded the 2025 IROS Toshio Fukuda Young Professional Award at 2025 IEEE/RSJ International Conference on Intelligent Robots and Systems.

Saman Amarasinghe, Professor, was awarded the 2025 ACM-IEEE CS Ken Kennedy Award.

Anantha Chandrakasan, the Vannevar Bush Professor of Electrical Engineering and Computer Science, was elected to the 2025-27 Committed to Caring cohort.

Anantha Chandrakasan, the Vannevar Bush Professor of Electrical Engineering and Computer Science, received the 2025 JSSC Test of Time Award from the IEEE Journal of Solid-State Circuits for his 1992 paper, “Low-power CMOS digital design”.

Yufeng (Kevin) Chen, Associate Professor, was awarded the 2025 IROS Toshio Fukuda Young Professional Award at 2025 IEEE/RSJ International Conference on Intelligent Robots and Systems.

Samantha Coday, Assistant Professor, was awarded the NSF CAREER Award for her project, “Flexible, Efficient, and Dense Power Converters Enabling a More Electric Future”.

Christina Delimitrou, Associate Professor, was awarded the inaugural 2025 Google ML and Systems Junior Faculty Award.

Joel Emer, Professor of the Practice in EECS, was awarded the 2025 Alan D. Berenbaum Distinguished Service Award from ACM SIGARCH.

Gabriele Farina, Assisant Professor, was awarded the 2023 AAAI/ACM SIGAI Doctoral Dissertation Award by AAAI and ACM SIGAI (who announced the prior three years of winners together), for his work entitled Game-Theoretic Decision Making in Imperfect-Information Games.

Dennis Freeman, the Henry Ellis Warren (1894) Professor, was elected to the 2025-27 Committed to Caring cohort.

Piotr Indyk, the Thomas D. and Virginia W. Cabot Professor, was elected to the National Academy of Engineering.

Stefanie Jegelka, Associate Professor, was awarded the Frank E. Perkins Award for Excellence in Graduate Advising in the School of Engineering.

Dina Katabi, the Thuan (1990) and Nicole Pham Professor, was elected to the National Academy of Medicine.

Yoon Kim, NBX Professor and Associate Professor, was named to the 2026 cohort of Sloan Research Fellows.

Steve Leeb, Emanuel E. Landsman (1958) Professor, was awarded the IEEE Sensors Journal Best Paper Award alongside Daniel Monagle and Eric A. Ponce, for their paper “Rule the Joule: An Energy Management Design Guide for Self-Powered Sensors”.

Laura Lewis, Athinoula A. Martinos Associate Professor, was elected to the 2025-27 Committed to Caring cohort.

Muriel Médard, NEC Professor of Software Science and Engineering, was elected an International Fellow of the United Kingdom’s Royal Academy of Engineering.

Muriel Médard, NEC Professor of Software Science and Engineering, was awarded the 2026 IEEE Richard W. Hamming medal “for contributions to coding for reliable communications and networking.”

Anand Natarajan, ITT Career Development Professor in Computer Technology, Associate Professor, was named to the 2026 cohort of Sloan Research Fellows.

Tomás Palacios, Clarence J. Lebel Professor in Electrical Engineering, was awarded the 2024 IEEE EDS George E. Smith Award alongside his group members Jung-Han Sharon Hsia and Joshua Andrew Perozek PhD ’24 for their paper, “First Demonstration of Optically-Controlled Vertical GaN finFET for Power Applications”.

Pablo Parillo, the Joseph F. and Nancy P. Keithley Professor, was recognized alongside Professor Jason Altshuler with the 2025 INFORMS Computing Society Prize for their pioneering work on accelerating gradient descent through stepsize hedging.

Daniela Rus, Panasonic Professor, was named to MassLive’s “12 innovation leaders to watch in 2025”.

Daniela Rus, Panasonic Professor, was named to AI Magazine’s “Top 100 Women in AI 2026”.

Nidhi Seethapathi, Assistant Professor, was named to MIT Technology review’s list of “2025 Innovators under 35”.

Devavrat Shah, Andrew (1956) and Erna Viterbi Professor, was invited to give the INFORMS Applied Probability Society Markov Lecture for 2024.

Devavrat Shah, Andrew (1956) and Erna Viterbi Professor, received the ACM Sigmetrics Achievement Award.

Vincent Sitzmann, Assistant Professor, was awarded the MIT School of Engineering’s Junior Bose Award.

Paris Smaragdis, Professor, was awarded the Best Paper Award at WASPAA (IEEE Workshop on Applications of Signal Processing to Audio and Acoustics) alongside Krishna Subramani, Takuya Higuchi, and Mehrez Souden for their paper “Rethinking Non-Negative Matrix Factorization with Implicit Neural Representations”.

Tess Smidt, Associate Professor, was named to the 2025 cohort of AI2050 Early Career Fellows by Schmidt Sciences.

Tess Smidt, Associate Professor, had a project accepted to the 2025 DOE Office of Science Early Career Research Program, “Hierarchical Representations of Complex Physical Systems with Euclidean Neural Networks”.

Tess Smidt, Associate Professor, is co-PI on a NSF AI Research Institute Award supporting the creation of the NSF AI-Materials Institute (AI-MI) at Cornell.

Justin Solomon, Associate Professor of EECS, was named to the 2025 cohort of Schmidt Science Polymaths.

Antonio Torralba, Delta Electronics Professor and faculty head of AI+D, was named to the 2025 cohort of ACM Fellows.

Vinod Vaikuntanathan, Ford Foundation Professor of Engineering, was named to the class of 2026 IACR Fellows by the International Association for Cryptologic Research.

Vinod Vaikuntanathan, Ford Foundation Professor of Engineering, was named to the class of 2026 Guggenheim Fellows.

Ryan Williams, Professor of EECS, was awarded Best Paper at STOC 2025 for his paper, “Simulating Time With Square-Root Space”.

Ashia Wilson, Assistant Professor, was awarded the MIT School of Engineering’s Junior Bose Award.

Mengjia Yan, Associate Professor, was named to the 2026 cohort of Sloan Research Fellows.

Nickolai Zeldovich, the Joan and Irwin M. (1957) Jacobs Professor, was named a 2026 MacVicar Faculty Fellow.

A greener way to 3D print stronger stuff

3D printing has come a long way since its invention in 1983 by Chuck Hull, who pioneered stereolithography, a technique that solidifies liquid resin into solid objects using ultraviolet lasers. Over the decades, 3D printers have evolved from experimental curiosities into tools capable of producing everything from custom prosthetics to complex food designs, architectural models, and even functioning human organs. 

But as the technology matures, its environmental footprint has become increasingly difficult to set aside. The vast majority of consumer and industrial 3D printing still relies on petroleum-based plastic filament. And while “greener” alternatives made from biodegradable or recycled materials exist, they come with a serious trade-off: they’re often not as strong. These eco-friendly filaments tend to become brittle under stress, making them ill-suited for structural applications or load-bearing parts — exactly where strength matters most.

This trade-off between sustainability and mechanical performance prompted researchers at MIT’s Computer Science and Artificial Intelligence Laboratory (CSAIL) and the Hasso Plattner Institute to ask: Is it possible to build objects that are mostly eco-friendly, but still strong where it counts?

Their answer is SustainaPrint, a new software and hardware toolkit designed to help users strategically combine strong and weak filaments to get the best of both worlds. Instead of printing an entire object with high-performance plastic, the system analyzes a model through finite element analysis simulations, predicts where the object is most likely to experience stress, and then reinforces just those zones with stronger material. The rest of the part can be printed using greener, weaker filament, reducing plastic use while preserving structural integrity.

“Our hope is that SustainaPrint can be used in industrial and distributed manufacturing settings one day, where local material stocks may vary in quality and composition,” says MIT PhD student and CSAIL researcher Maxine Perroni-Scharf, who is a lead author on a paper presenting the project. “In these contexts, the testing toolkit could help ensure the reliability of available filaments, while the software’s reinforcement strategy could reduce overall material consumption without sacrificing function.” 

For their experiments, the team used Polymaker’s PolyTerra PLA as the eco-friendly filament, and standard or Tough PLA from Ultimaker for reinforcement. They used a 20 percent reinforcement threshold to show that even a small amount of strong plastic goes a long way. Using this ratio, SustainaPrint was able to recover up to 70 percent of the strength of an object printed entirely with high-performance plastic.

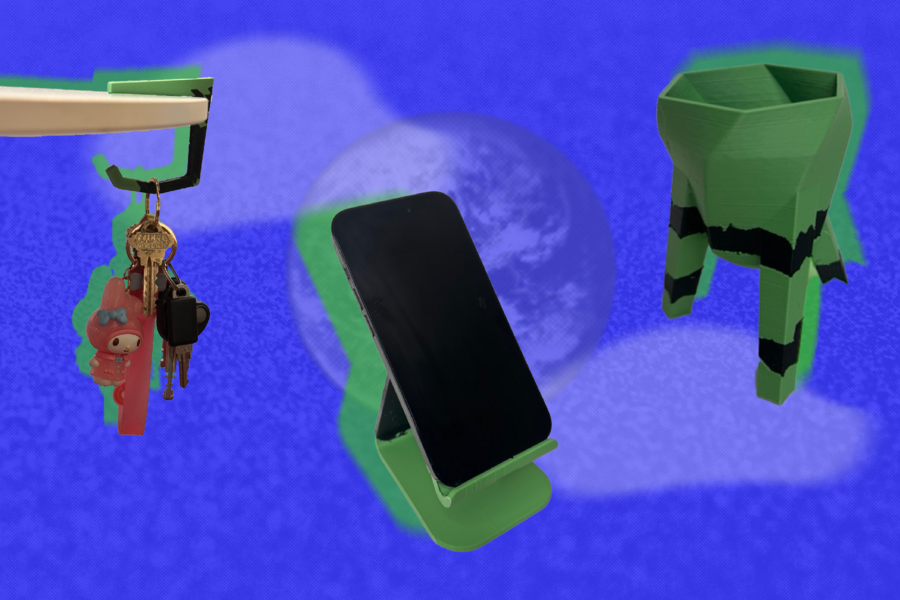
They printed dozens of objects, from simple mechanical shapes like rings and beams to more functional household items such as headphone stands, wall hooks, and plant pots. Each object was printed three ways: once using only eco-friendly filament, once using only strong PLA, and once with the hybrid SustainaPrint configuration. The printed parts were then mechanically tested by pulling, bending, or otherwise breaking them to measure how much force each configuration could withstand. 

In many cases, the hybrid prints held up nearly as well as the full-strength versions. For example, in one test involving a dome-like shape, the hybrid version outperformed the version printed entirely in Tough PLA. The team believes this may be due to the reinforced version’s ability to distribute stress more evenly, avoiding the brittle failure sometimes caused by excessive stiffness.

“This indicates that in certain geometries and loading conditions, mixing materials strategically may actually outperform a single homogenous material,” says Perroni-Scharf. “It’s a reminder that real-world mechanical behavior is full of complexity, especially in 3D printing, where interlayer adhesion and tool path decisions can affect performance in unexpected ways.”

A lean, green, eco-friendly printing machine

SustainaPrint starts off by letting a user upload their 3D model into a custom interface. By selecting fixed regions and areas where forces will be applied, the software then uses an approach called “Finite Element Analysis” to simulate how the object will deform under stress. It then creates a map showing pressure distribution inside the structure, highlighting areas under compression or tension, and applies heuristics to segment the object into two categories: those that need reinforcement, and those that don’t.

Recognizing the need for accessible and low-cost testing, the team also developed a DIY testing toolkit to help users assess strength before printing. The kit has a 3D-printable device with modules for measuring both tensile and flexural strength. Users can pair the device with common items like pull-up bars or digital scales to get rough, but reliable performance metrics. The team benchmarked their results against manufacturer data and found that their measurements consistently fell within one standard deviation, even for filaments that had undergone multiple recycling cycles.

Although the current system is designed for dual-extrusion printers, the researchers believe that with some manual filament swapping and calibration, it could be adapted for single-extruder setups, too. In current form, the system simplifies the modeling process by allowing just one force and one fixed boundary per simulation. While this covers a wide range of common use cases, the team sees future work expanding the software to support more complex and dynamic loading conditions. The team also sees potential in using AI to infer the object’s intended use based on its geometry, which could allow for fully automated stress modeling without manual input of forces or boundaries.

3D for free

The researchers plan to release SustainaPrint open-source, making both the software and testing toolkit available for public use and modification. Another initiative they aspire to bring to life in the future: education. “In a classroom, SustainaPrint isn’t just a tool, it’s a way to teach students about material science, structural engineering, and sustainable design, all in one project,” says Perroni-Scharf. “It turns these abstract concepts into something tangible.”

As 3D printing becomes more embedded in how we manufacture and prototype everything from consumer goods to emergency equipment, sustainability concerns will only grow. With tools like SustainaPrint, those concerns no longer need to come at the expense of performance. Instead, they can become part of the design process: built into the very geometry of the things we make.

Co-author Patrick Baudisch, who is a professor at the Hasso Plattner Institute, adds that “the project addresses a key question: What is the point of collecting material for the purpose of recycling, when there is no plan to actually ever use that material? Maxine presents the missing link between the theoretical/abstract idea of 3D printing material recycling and what it actually takes to make this idea relevant.”

Perroni-Scharf and Baudisch wrote the paper with CSAIL research assistant Jennifer Xiao; MIT Department of Electrical Engineering and Computer Science master’s student Cole Paulin ’24; master’s student Ray Wang SM ’25 and PhD student Ticha Sethapakdi SM ’19 (both CSAIL members); Hasso Plattner Institute PhD student Muhammad Abdullah; and Associate Professor Stefanie Mueller, lead of the Human-Computer Interaction Engineering Group at CSAIL.

The researchers’ work was supported by a Designing for Sustainability Grant from the Designing for Sustainability MIT-HPI Research Program. Their work will be presented at the ACM Symposium on User Interface Software and Technology in September.

MIT software tool turns everyday objects into animated, eye-catching displays

Whether you’re an artist, advertising specialist, or just looking to spruce up your home, turning everyday objects into dynamic displays is a great way to make them more visually engaging. For example, you could turn a kids’ book into a handheld cartoon of sorts, making the reading experience more immersive and memorable for a child.

But now, thanks to MIT researchers, it’s also possible to make dynamic displays without using electronics, using barrier-grid animations (or scanimations), which use printed materials instead. This visual trick involves sliding a patterned sheet across an image to create the illusion of a moving image. The secret of barrier-grid animations lies in its name: An overlay called a barrier (or grid) often resembling a picket fence moves across, rotates around, or tilts toward an image to reveal frames in an animated sequence. That underlying picture is a combination of each still, sliced and interwoven to present a different snapshot depending on the overlay’s position.

While tools exist to help artists create barrier-grid animations, they’re typically used to create barrier patterns that have straight lines. Building off of previous work in creating images that appear to move, researchers at MIT’s Computer Science and Artificial Intelligence Laboratory (CSAIL) have developed a tool that allows users to explore more unconventional designs. From zigzags to circular patterns, the team’s “FabObscura” software turns unique concepts into printable scanimations, helping users add dynamic animations to things like pictures, toys, and decor.

MIT Department of Electrical Engineering and Computer Science (EECS) PhD student and CSAIL researcher Ticha Sethapakdi SM ’19, a lead author on a paper presenting FabObscura, says that the system is a one-size-fits-all tool for customizing barrier-grid animations. This versatility extends to unconventional, elaborate overlay designs, like pointed, angled lines to animate a picture you might put on your desk, or the swirling, hypnotic appearance of a radial pattern you could spin over an image placed on a coin or a Frisbee.

The FabObscura tool transforms everyday objects into animated displays. Video: MIT CSAIL

“Our system can turn a seemingly static, abstract image into an attention-catching animation,” says Sethapakdi. “The tool lowers the barrier to entry to creating these barrier-grid animations, while helping users express a variety of designs that would’ve been very time-consuming to explore by hand.”

Behind these novel scanimations is a key finding: Barrier patterns can be expressed as any continuous mathematical function — not just straight lines. Users can type these equations into a text box within the FabObscura program, and then see how it graphs out the shape and movement of a barrier pattern. If you wanted a traditional horizontal pattern, you’d enter in a constant function, where the output is the same no matter the input, much like drawing a straight line across a graph. For a wavy design, you’d use a sine function, which is smooth and resembles a mountain range when plotted out. The system’s interface includes helpful examples of these equations to guide users toward their preferred pattern.

A simple interface for elaborate ideas

FabObscura works for all known types of barrier-grid animations, supporting a variety of user interactions. The system enables the creation of a display with an appearance that changes depending on your viewpoint. FabObscura also allows you to create displays that you can animate by sliding or rotating a barrier over an image.

To produce these designs, users can upload a folder of frames of an animation (perhaps a few stills of a horse running), or choose from a few preset sequences (like an eye blinking) and specify the angle your barrier will move. After previewing your design, you can fabricate the barrier and picture onto separate transparent sheets (or print the image on paper) using a standard 2D printer, such as an inkjet. Your image can then be placed and secured on flat, handheld items such as picture frames, phones, and books.

You can enter separate equations if you want two sequences on one surface, which the researchers call “nested animations.” Depending on how you move the barrier, you’ll see a different story being told. For example, CSAIL researchers created a car that rotates when you move its sheet vertically, but transforms into a spinning motorcycle when you slide the grid horizontally.

These customizations lead to unique household items, too. The researchers designed an interactive coaster that you can switch from displaying a “coffee” icon to symbols of a martini and a glass of water by pressing your fingers down on the edges of its surface. The team also spruced up a jar of sunflower seeds, producing a flower animation on the lid that blooms when twisted off.

Artists, including graphic designers and printmakers, could also use this tool to make dynamic pieces without needing to connect any wires. The tool saves them crucial time to explore creative, low-power designs, such as a clock with a mouse that runs along as it ticks. FabObscura could produce animated food packaging, or even reconfigurable signage for places like construction sites or stores that notify people when a particular area is closed or a machine isn’t working.

Keep it crisp

FabObscura’s barrier-grid creations do come with certain trade-offs. While nested animations are novel and more dynamic than a single-layer scanimation, their visual quality isn’t as strong. The researchers wrote design guidelines to address these challenges, recommending users upload fewer frames for nested animations to keep the interlaced image simple and stick to high-contrast images for a crisper presentation.

In the future, the researchers intend to expand what users can upload to FabObscura, like being able to drop in a video file that the program can then select the best frames from. This would lead to even more expressive barrier-grid animations.

FabObscura might also step into a new dimension: 3D. While the system is currently optimized for flat, handheld surfaces, CSAIL researchers are considering implementing their work into larger, more complex objects, possibly using 3D printers to fabricate even more elaborate illusions.

Sethapakdi wrote the paper with several CSAIL affiliates: Zhejiang University PhD student and visiting researcher Mingming Li; MIT EECS PhD student Maxine Perroni-Scharf; MIT postdoc Jiaji Li; MIT associate professors Arvind Satyanarayan and Justin Solomon; and senior author and MIT Associate Professor Stefanie Mueller, leader of the Human-Computer Interaction (HCI) Engineering Group at CSAIL. Their work will be presented at the ACM Symposium on User Interface Software and Technology (UIST) this month

A human-centered approach to data visualization

The world is awash in data visualizations, from charts accompanying news stories on the economy to graphs tracking the weekly temperature to scatterplots showing relationships between baseball statistics.

At their core, data visualizations convey information, and everyone consumes that information differently. One person might scan the axes, while another may focus on an outlying data point or examine the magnitude of each colored bar.

But how do you consume that information if you can’t see it?

Making a data visualization accessible for blind and low-vision readers often involves writing a descriptive caption that captures some key points in a succinct paragraph.

“But that means blind and low-vision readers don’t get the ability to interpret the data for themselves. What if they had a different question about the data? Suddenly a simple caption doesn’t give them that. The core idea behind our group’s work in accessibility has been to maintain agency for blind and low-vision people,” says Arvind Satyanarayan, a newly tenured associate professor in the MIT Department of Electrical Engineering and Computer Science (EECS) and member of the Computer Science and Artificial Intelligence Laboratory (CSAIL).

Satyanarayan’s group has explored making data visualizations accessible for screen readers, which narrate content on a computer screen. His team created a hierarchical platform that allows screen reader users to explore various levels of detail in a visualization with their keyboard, drilling down from high-level information to individual data points.

Under the umbrella of human-computer interaction (HCI) research, Satyanarayan’s Visualization Group also develops programming languages and authoring tools for visualizations, studies the sociocultural elements of visualization design, and uses visualizations to analyze machine-learning models.

For Satyanarayan, HCI is about promoting human agency, whether that means enabling a blind reader to interpret data trends or ensuring designers still feel in control of AI-driven visualization systems.

“We really take a human-centered approach to data visualization,” he says.

An eye for technology

Satyanarayan found the field of data visualization almost by accident.

As a child growing up in India, Bahrain, and Abu Dhabi, his initial interest in science sprouted from his love for tinkering.

Satyanarayan recalls his father bringing home a laptop, which he loaded with simple games. The internet grew up along with him, and as a teenager he became heavily engaged in the popular blogging platform Movable Type.

A teacher at heart even as a teenager, Satyanarayan offered tutorials on how to use the platform and ran a contest for people to style their blog. Along the way, he taught himself the skills to develop plugins and extensions.

He enjoyed designing eye-catching and user-friendly blogs, laying the foundation for his studies in human-computer interaction.

When he arrived at the University of California at San Diego for college, he was interested enough in the HCI field to take an introductory class.

“I’d always been a student of history, and this intro class really appealed to me because it was more about the history of user interfaces, and tracing the provenance and development of the ideas behind them,” he says.

Almost as an afterthought, he spoke with the professor, Jim Hollan — a pioneer of the field. Even though he hadn’t thought much about research beforehand, Satyanarayan ended up spending the summer in Hollan’s lab, studying how people interact with wall-sized displays.

As he prepared to pursue graduate studies (Satyanarayan split his PhD between Stanford University and the University of Washington), he was unsure whether to focus on programming languages or HCI. When it came time to choose, the human-centered focus of HCI and the interdisciplinarity of data visualization drew him in.

“Data visualization is deeply technical, but it also draws from cognitive science, perceptual psychology, and visual arts and aesthetics, and then it also has a big stake in civic and social responsibility,” he says.

He saw how visualization plays a role in civic and social responsibility through his first project with his PhD advisor, Jeffrey Heer. Satyanarayan and his collaborators built a data visualization interface for journalists at newsrooms that couldn’t afford to hire data departments. That drag-and-drop tool allowed journalists to design the visualization and all the data storytelling they wanted to do around it.

That project seeded many elements that became his thesis, for which he studied new programming languages for visualization and developed interactive graphical systems on top of them.

After earning his PhD, Satyanarayan sought a faculty job and spent an exhausting interview season crisscrossing the country, participating in 15 interviews in only two months.

MIT was his very last stop.

“I remember being exhausted and on autopilot, thinking that this is not going well. But then, the first day of my interview at MIT was filled with some of the best conversations I had. People were so eager and interested in understanding my research and how it connected to theirs,” he says.

Charting a collaborative course

The collaborative nature of MIT remained important as he built his research group; one of the group’s first graduate students was pursuing a PhD in MIT’s program in History, Anthropology, and Science, Technology, and Society. They continue to work closely with faculty who study anthropology, topics in the humanities, and clinical machine learning.

With interdisciplinary collaborators, the Visualization Group has explored the sociotechnical implications of data visualizations. For instance, charts are frequently shared, disseminated, and discussed on social media, where they are stripped of their context.

“What happens as a result is they can become vectors for misinformation or misunderstanding. But that is not because they are poorly designed to begin with. We spent a lot of time unpacking those details,” Satyanarayan says.

His group is also studying tactile graphics, which are common in museums to help blind and low-vision individuals interact with exhibits. Often, making a tactile graphic boils down to 3D-printing a chart.

“But a chart was designed to be read with our eyes, and our eyes work very differently than our fingers. We are now drilling into what it means to design tactile-first visualizations,” he says.

Co-design is a driving principle behind all his group’s accessibility work. On many projects, they work closely with Daniel Hajas, a researcher at the University College of London who has been blind since the age of 16.

“That has been really important for us, to make sure as people who are not blind, that we are developing tools and platforms that are actually useful for blind and low-vision people,” he says.

His group is also studying the sociocultural implications of data visualization. For instance, during the height of the Covid-19 pandemic, data visualizations were often turned into memes and social artifacts that were used to support or contest data from experts.

“In reality, neither data nor visualizations are neutral. We’ve been thinking about the data you use to visualize, and the design choices behind specific visualizations, and what that is communicating besides insights about the data,” he says.

Visualizing a real-world impact

Interdisciplinarity is also a theme of Satyanarayan’s interactive data visualization class, which he co-teaches with faculty members Sarah Williams and Catherine D’Ignazio in the Department of Urban Studies and Planning; and Crystal Lee in Comparative Media Studies/Writing, with shared appointments in the School of Arts, Humanities, and Social Sciences and the MIT Schwarzman College of Computing.

In the popular course, students not only learn the technical skills to make data visualizations, but they also build final projects centered on an area of social importance. For the past two years, students have focused on the housing affordability crisis in the Boston area, in partnership with the Massachusetts Area Planning Council. The students enjoy the opportunity to make a real-world impact with their work, Satyanarayan says.

And he enjoys the course as much as they do.

“I love teaching. I really enjoy getting to interact with the students. Our students are so intellectually curious and committed. It reassures me that our future is in good hands,” he says.

One of Satyanarayan’s personal interests is running along the Charles River Esplanade in Boston, which he does almost every day. He also enjoys cooking, especially with ingredients he has never used before.

Satyanarayan and his wife, who met while they were graduate students at Stanford (her PhD is in microbiology), also delight in tending their plot in the Fenway Victory Gardens, which is overflowing with lilies, lavender, lilacs, peonies, and roses.

Their newest addition is a miniature poodle puppy named Fen, which they got when Satyanarayan earned tenure earlier this year.

Thinking toward the future of his research, Satyanarayan is keen to further explore how generative AI might effectively assist people in building visualizations, and its implications for human creativity.

“In the world of generative AI, this question of agency applies to all of us,” he says. “How do we make sure, for these AI-driven systems, that we haven’t lost the parts of the work we find most interesting?”

Alzheimer’s erodes brain cells’ control of gene expression, undermining function, cognition

Most people recognize Alzheimer’s disease from its devastating symptoms such as memory loss, while new drugs target pathological aspects of disease manifestations, such as plaques of amyloid proteins. Now, a sweeping new open-access study in the Sept. 4 edition of Cell by MIT researchers shows the importance of understanding the disease as a battle over how well brain cells control the expression of their genes. The study paints a high-resolution picture of a desperate struggle to maintain healthy gene expression and gene regulation, where the consequences of failure or success are nothing less than the loss or preservation of cell function and cognition.

The study presents a first-of-its-kind, multimodal atlas of combined gene expression and gene regulation spanning 3.5 million cells from six brain regions, obtained by profiling 384 post-mortem brain samples across 111 donors. The researchers profiled both the “transcriptome,” showing which genes are expressed into RNA, and the “epigenome,” the set of chromosomal modifications that establish which DNA regions are accessible and thus utilized between different cell types.

The resulting atlas revealed many insights showing that the progression of Alzheimer’s is characterized by two major epigenomic trends. The first is that vulnerable cells in key brain regions suffer a breakdown of the rigorous nuclear “compartments” they normally maintain to ensure some parts of the genome are open for expression but others remain locked away. The second major finding is that susceptible cells experience a loss of “epigenomic information,” meaning they lose their grip on the unique pattern of gene regulation and expression that gives them their specific identity and enables their healthy function.

Accompanying the evidence of compromised compartmentalization and the erosion of epigenomic information are many specific findings pinpointing molecular circuitry that breaks down by cell type, by region, and gene network. They found, for instance, that when epigenomic conditions deteriorate, that opens the door to expression of many genes associated with disease, whereas if cells manage to keep their epigenomic house in order, they can keep disease-associated genes in check. Moreover, the researchers clearly saw that when the epigenomic breakdowns were occurring people lost cognitive ability, but where epigenomic stability remained, so did cognition.

“To understand the circuitry, the logic responsible for gene expression changes in Alzheimer’s disease [AD], we needed to understand the regulation and upstream control of all the changes that are happening, and that’s where the epigenome comes in,” says senior author Manolis Kellis, a professor in the Department of Electrical Engineering and Computer Science and the Computer Science and Artificial Intelligence Lab and head of MIT’s Computational Biology Group. “This is the first large-scale, single-cell, multi-region gene-regulatory atlas of AD, systematically dissecting the dynamics of epigenomic and transcriptomic programs across disease progression and resilience.”

By providing that detailed examination of the epigenomic mechanisms of Alzheimer’s progression, the study provides a blueprint for devising new Alzheimer’s treatments that can target factors underlying the broad erosion of epigenomic control or the specific manifestations that affect key cell types such as neurons and supporting glial cells.

“The key to developing new and more effective treatments for Alzheimer’s disease depends on deepening our understanding of the mechanisms that contribute to the breakdowns of cellular and network function in the brain,” says Picower Professor and co-corresponding author Li-Huei Tsai, director of The Picower Institute for Learning and Memory and a founding member of MIT’s Aging Brain Initiative, along with Kellis. “This new data advances our understanding of how epigenomic factors drive disease.”

Kellis Lab members Zunpeng Liu and Shanshan Zhang are the study’s co-lead authors.

Compromised compartments and eroded information

Among the post-mortem brain samples in the study, 57 came from donors to the Religious Orders Study or the Rush Memory and Aging Project (collectively known as “ROSMAP”) who did not have AD pathology or symptoms, while 33 came from donors with early-stage pathology and 21 came from donors at a late stage. The samples therefore provided rich information about the symptoms and pathology each donor was experiencing before death.

In the new study, Liu and Zhang combined analyses of single-cell RNA sequencing of the samples, which measures which genes are being expressed in each cell, and ATACseq, which measures whether chromosomal regions are accessible for gene expression. Considered together, these transcriptomic and epigenomic measures enabled the researchers to understand the molecular details of how gene expression is regulated across seven broad classes of brain cells (e.g., neurons or other glial cell types) and 67 subtypes of cell types (e.g., 17 kinds of excitatory neurons or six kinds of inhibitory ones).

The researchers annotated more than 1 million gene-regulatory control regions that different cells employ to establish their specific identities and functionality using epigenomic marking. Then, by comparing the cells from Alzheimer’s brains to the ones without, and accounting for stage of pathology and cognitive symptoms, they could produce rigorous associations between the erosion of these epigenomic markings, and ultimately loss of function.

For instance, they saw that among people who advanced to late-stage AD, normally repressive compartments opened up for more expression and compartments that were normally more open during health became more repressed. Worryingly, when the normally repressive compartments of brain cells opened up, they became more afflicted with disease.

“For Alzheimer’s patients, repressive compartments opened up, and gene expression levels increased, which was associated with decreased cognitive function,” explains Liu.

But when cells managed to keep their compartments in order such that they expressed the genes they were supposed to, people remained cognitively intact.

Meanwhile, based on the cells’ expression of their regulatory elements, the researchers created an epigenomic information score for each cell. Generally, information declined as pathology progressed, but that was particularly notable among cells in the two brain regions affected earliest in Alzheimer’s: the entorhinal cortex and the hippocampus. The analyses also highlighted specific cell types that were especially vulnerable including microglia that play immune and other roles, oligodendrocytes that produce myelin insulation for neurons, and particular kinds of excitatory neurons.

Risk genes and “chromatin guardians”

Detailed analyses in the paper highlighted how epigenomic regulation tracked with disease-related problems, Liu notes. The e4 variant of the APOE gene, for instance, is widely understood to be the single biggest genetic risk factor for Alzheimer’s. In APOE4 brains, microglia initially responded to the emerging disease pathology with an increase in their epigenomic information, suggesting that they were stepping up to their unique responsibility to fight off disease. But as the disease progressed, the cells exhibited a sharp drop off in information, a sign of deterioration and degeneration. This turnabout was strongest in people who had two copies of APOE4, rather than just one. The findings, Kellis said, suggest that APOE4 might destabilize the genome of microglia, causing them to burn out.

Another example is the fate of neurons expressing the gene RELN and its protein Reelin. Prior studies, including by Kellis and Tsai, have shown that RELN- expressing neurons in the entorhinal cortex and hippocampus are especially vulnerable in Alzheimer’s, but promote resilience if they survive. The new study sheds new light on their fate by demonstrating that they exhibit early and severe epigenomic information loss as disease advances, but that in people who remained cognitively resilient the neurons maintained epigenomic information.

In yet another example, the researchers tracked what they colloquially call “chromatin guardians” because their expression sustains and regulates cells’ epigenomic programs. For instance, cells with greater epigenomic erosion and advanced AD progression displayed increased chromatin accessibility in areas that were supposed to be locked down by Polycomb repression genes or other gene expression silencers. While resilient cells expressed genes promoting neural connectivity, epigenomically eroded cells expressed genes linked to inflammation and oxidative stress.

“The message is clear: Alzheimer’s is not only about plaques and tangles, but about the erosion of nuclear order itself,” Kellis says. “Cognitive decline emerges when chromatin guardians lose ground to the forces of erosion, switching from resilience to vulnerability at the most fundamental level of genome regulation.

“And when our brain cells lose their epigenomic memory marks and epigenomic information at the lowest level deep inside our neurons and microglia, it seems that Alheimer’s patients also lose their memory and cognition at the highest level.”

Other authors of the paper are Benjamin T. James, Kyriaki Galani, Riley J. Mangan, Stuart Benjamin Fass, Chuqian Liang, Manoj M. Wagle, Carles A. Boix, Yosuke Tanigawa, Sukwon Yun, Yena Sung, Xushen Xiong, Na Sun, Lei Hou, Martin Wohlwend, Mufan Qiu, Xikun Han, Lei Xiong, Efthalia Preka, Lei Huang, William F. Li, Li-Lun Ho, Amy Grayson, Julio Mantero, Alexey Kozlenkov, Hansruedi Mathys, Tianlong Chen, Stella Dracheva, and David A. Bennett.

Funding for the research came from the National Institutes of Health, the National Science Foundation, the Cure Alzheimer’s Fund, the Freedom Together Foundation, the Robert A. and Renee E. Belfer Family Foundation, Eduardo Eurnekian, and Joseph P. DiSabato.

A new generative AI approach to predicting chemical reactions

Many attempts have been made to harness the power of new artificial intelligence and large language models (LLMs) to try to predict the outcomes of new chemical reactions. These have had limited success, in part because until now they have not been grounded in an understanding of fundamental physical principles, such as the laws of conservation of mass. Now, a team of researchers at MIT has come up with a way of incorporating these physical constraints on a reaction prediction model, and thus greatly improving the accuracy and reliability of its outputs.

The new work was reported Aug. 20 in the journal Nature, in a paper by recent postdoc Joonyoung Joung (now an assistant professor at Kookmin University, South Korea); former software engineer Mun Hong Fong (now at Duke University); chemical engineering graduate student Nicholas Casetti; postdoc Jordan Liles; physics undergraduate student Ne Dassanayake; and senior author Connor Coley, who is the Class of 1957 Career Development Professor in the MIT departments of Chemical Engineering and Electrical Engineering and Computer Science.

“The prediction of reaction outcomes is a very important task,” Joung explains. For example, if you want to make a new drug, “you need to know how to make it. So, this requires us to know what product is likely” to result from a given set of chemical inputs to a reaction. But most previous efforts to carry out such predictions look only at a set of inputs and a set of outputs, without looking at the intermediate steps or considering the constraints of ensuring that no mass is gained or lost in the process, which is not possible in actual reactions.

Joung points out that while large language models such as ChatGPT have been very successful in many areas of research, these models do not provide a way to limit their outputs to physically realistic possibilities, such as by requiring them to adhere to conservation of mass. These models use computational “tokens,” which in this case represent individual atoms, but “if you don’t conserve the tokens, the LLM model starts to make new atoms, or deletes atoms in the reaction.” Instead of being grounded in real scientific understanding, “this is kind of like alchemy,” he says. While many attempts at reaction prediction only look at the final products, “we want to track all the chemicals, and how the chemicals are transformed” throughout the reaction process from start to end, he says.

In order to address the problem, the team made use of a method developed back in the 1970s by chemist Ivar Ugi, which uses a bond-electron matrix to represent the electrons in a reaction. They used this system as the basis for their new program, called FlowER (Flow matching for Electron Redistribution), which allows them to explicitly keep track of all the electrons in the reaction to ensure that none are spuriously added or deleted in the process.

The system uses a matrix to represent the electrons in a reaction, and uses nonzero values to represent bonds or lone electron pairs and zeros to represent a lack thereof. “That helps us to conserve both atoms and electrons at the same time,” says Fong. This representation, he says, was one of the key elements to including mass conservation in their prediction system.

The system they developed is still at an early stage, Coley says. “The system as it stands is a demonstration — a proof of concept that this generative approach of flow matching is very well suited to the task of chemical reaction prediction.” While the team is excited about this promising approach, he says, “we’re aware that it does have specific limitations as far as the breadth of different chemistries that it’s seen.” Although the model was trained using data on more than a million chemical reactions, obtained from a U.S. Patent Office database, those data do not include certain metals and some kinds of catalytic reactions, he says.

“We’re incredibly excited about the fact that we can get such reliable predictions of chemical mechanisms” from the existing system, he says. “It conserves mass, it conserves electrons, but we certainly acknowledge that there’s a lot more expansion and robustness to work on in the coming years as well.”

But even in its present form, which is being made freely available through the online platform GitHub, “we think it will make accurate predictions and be helpful as a tool for assessing reactivity and mapping out reaction pathways,” Coley says. “If we’re looking toward the future of really advancing the state of the art of mechanistic understanding and helping to invent new reactions, we’re not quite there. But we hope this will be a steppingstone toward that.”

“It’s all open source,” says Fong. “The models, the data, all of them are up there,” including a previous dataset developed by Joung that exhaustively lists the mechanistic steps of known reactions. “I think we are one of the pioneering groups making this dataset, and making it available open-source, and making this usable for everyone,” he says.

The FlowER model matches or outperforms existing approaches in finding standard mechanistic pathways, the team says, and makes it possible to generalize to previously unseen reaction types. They say the model could potentially be relevant for predicting reactions for medicinal chemistry, materials discovery, combustion, atmospheric chemistry, and electrochemical systems.

In their comparisons with existing reaction prediction systems, Coley says, “using the architecture choices that we’ve made, we get this massive increase in validity and conservation, and we get a matching or a little bit better accuracy in terms of performance.”

He adds that “what’s unique about our approach is that while we are using these textbook understandings of mechanisms to generate this dataset, we’re anchoring the reactants and products of the overall reaction in experimentally validated data from the patent literature.” They are inferring the underlying mechanisms, he says, rather than just making them up. “We’re imputing them from experimental data, and that’s not something that has been done and shared at this kind of scale before.”

The next step, he says, is “we are quite interested in expanding the model’s understanding of metals and catalytic cycles. We’ve just scratched the surface in this first paper,” and most of the reactions included so far don’t include metals or catalysts, “so that’s a direction we’re quite interested in.”

In the long term, he says, “a lot of the excitement is in using this kind of system to help discover new complex reactions and help elucidate new mechanisms. I think that the long-term potential impact is big, but this is of course just a first step.”

The work was supported by the Machine Learning for Pharmaceutical Discovery and Synthesis consortium and the National Science Foundation.

New laser “comb” can enable rapid identification of chemicals with extreme precision

Optical frequency combs are specially designed lasers that act like rulers to accurately and rapidly measure specific frequencies of light. They can be used to detect and identify chemicals and pollutants with extremely high precision.

Frequency combs would be ideal for remote sensors or portable spectrometers because they can enable accurate, real-time monitoring of multiple chemicals without complex moving parts or external equipment.

But developing frequency combs with high enough bandwidth for these applications has been a challenge. Often, researchers must add bulky components that limit scalability and performance.

Now, a team of MIT researchers has demonstrated a compact, fully integrated device that uses a carefully crafted mirror to generate a stable frequency comb with very broad bandwidth. The mirror they developed, along with an on-chip measurement platform, offers the scalability and flexibility needed for mass-producible remote sensors and portable spectrometers. This development could enable more accurate environmental monitors that can identify multiple harmful chemicals from trace gases in the atmosphere.

“The broader the bandwidth a spectrometer has, the more powerful it is, but dispersion is in the way. Here we took the hardest problem that limits bandwidth and made it the centerpiece of our study, addressing every step to ensure robust frequency comb operation,” says Qing Hu, Distinguished Professor in Electrical Engineering and Computer Science at MIT, principal investigator in the Research Laboratory of Electronics, and senior author on an open-access paper describing the work.

He is joined on the paper by lead author Tianyi Zeng PhD ’23; as well as Yamac Dikmelik of General Dynamics Mission Systems; Feng Xie and Kevin Lascola of Thorlabs Quantum Electronics; and David Burghoff SM ’09, PhD ’14, an assistant professor at the University of Texas at Austin. The research appears today in Light: Science and Applications.

Broadband combs

An optical frequency comb produces a spectrum of equally spaced laser lines, which resemble the teeth of a comb.

Scientists can generate frequency combs using several types of lasers for different wavelengths. By using a laser that produces long wave infrared radiation, such as a quantum cascade laser, they can use frequency combs for high-resolution sensing and spectroscopy.

In dual-comb spectroscopy (DCS), the beam of one frequency comb travels straight through the system and strikes a detector at the other end. The beam of the second frequency comb passes through a chemical sample before striking the same detector. Using the results from both combs, scientists can faithfully replicate the chemical features of the sample at much lower frequencies, where signals can be easily analyzed.

The frequency combs must have high bandwidth, or they will only be able to detect a small frequency range of chemical compounds, which could lead to false alarms or inaccurate results.

Dispersion is the most important factor that limits a frequency comb’s bandwidth. If there is dispersion, the laser lines are not evenly spaced, which is incompatible with the formation of frequency combs.

“With long wave infrared radiation, the dispersion will be very high. There is no way to get around it, so we have to find a way to compensate for it or counteract it by engineering our system,” Hu says.

Many existing approaches aren’t flexible enough to be used in different scenarios or don’t enable high enough bandwidth.

Hu’s group previously solved this problem in a different type of frequency comb, one that used terahertz waves, by developing a double-chirped mirror (DCM).

A DCM is a special type of optical mirror that has multiple layers with thicknesses that change gradually from one end to the other. They found that this DCM, which has a corrugated structure, could effectively compensate for dispersion when used with a terahertz laser.

“We tried to borrow this trick and apply it to an infrared comb, but we ran into lots of challenges,” Hu says.

Because infrared waves are 10 times shorter than terahertz waves, fabricating the new mirror required an extreme level of precision. At the same time, they needed to coat the entire DCM in a thick layer of gold to remove the heat under laser operation. Plus, their dispersion measurement system, designed for terahertz waves, wouldn’t work with infrared waves, which have frequencies that are about 10 times higher than terahertz.

“After more than two years of trying to implement this scheme, we reached a dead end,” Hu says.

A new solution

Ready to throw in the towel, the team realized something they had missed. They had designed the mirror with corrugation to compensate for the lossy terahertz laser, but infrared radiation sources aren’t as lossy.

This meant they could use a standard DCM design to compensate for dispersion, which is compatible with infrared radiation. However, they still needed to create curved mirror layers to capture the beam of the laser, which made fabrication much more difficult than usual.

“The adjacent layers of mirror differ only by tens of nanometers. That level of precision precludes standard photolithography techniques. On top of that, we still had to etch very deeply into the notoriously stubborn material stacks. Achieving those critical dimensions and etch depths was key to unlocking broadband comb performance,” Zeng says. In addition to precisely fabricating the DCM, they integrated the mirror directly onto the laser, making the device extremely compact. The team also developed a high-resolution, on-chip dispersion measurement platform that doesn’t require bulky external equipment.

“Our approach is flexible. As long as we can use our platform to measure the dispersion, we can design and fabricate a DCM that compensates for it,” Hu adds.

Taken together, the DCM and on-chip measurement platform enabled the team to generate stable infrared laser frequency combs that had far greater bandwidth than can usually be achieved without a DCM.

In the future, the researchers want to extend their approach to other laser platforms that could generate combs with even greater bandwidth and higher power for more demanding applications.

“These researchers developed an ingenious nanophotonic dispersion compensation scheme based on an integrated air–dielectric double-chirped mirror. This approach provides unprecedented control over dispersion, enabling broadband comb formation at room temperature in the long-wave infrared. Their work opens the door to practical, chip-scale frequency combs for applications ranging from chemical sensing to free-space communications,” says Jacob B. Khurgin, a professor at the Johns Hopkins University Whiting School of Engineering, who was not involved with this paper.

This work is funded, in part, by the U.S. Defense Advanced Research Projects Agency (DARPA) and the Gordon and Betty Moore Foundation. This work was carried out, in part, using facilities at MIT.nano.

New method could monitor corrosion and cracking in a nuclear reactor

MIT researchers have developed a technique that enables real-time, 3D monitoring of corrosion, cracking, and other material failure processes inside a nuclear reactor environment.

This could allow engineers and scientists to design safer nuclear reactors that also deliver higher performance for applications like electricity generation and naval vessel propulsion.

During their experiments, the researchers utilized extremely powerful X-rays to mimic the behavior of neutrons interacting with a material inside a nuclear reactor.

They found that adding a buffer layer of silicon dioxide between the material and its substrate, and keeping the material under the X-ray beam for a longer period of time, improves the stability of the sample. This allows for real-time monitoring of material failure processes.

By reconstructing 3D image data on the structure of a material as it fails, researchers could design more resilient materials that can better withstand the stress caused by irradiation inside a nuclear reactor.

“If we can improve materials for a nuclear reactor, it means we can extend the life of that reactor. It also means the materials will take longer to fail, so we can get more use out of a nuclear reactor than we do now. The technique we’ve demonstrated here allows to push the boundary in understanding how materials fail in real-time,” says Ericmoore Jossou, who has shared appointments in the Department of Nuclear Science and Engineering (NSE), where he is the John Clark Hardwick Professor, and the Department of Electrical Engineering and Computer Science (EECS), and the MIT Schwarzman College of Computing.

Jossou, senior author of a study on this technique, is joined on the paper by lead author David Simonne, an NSE postdoc; Riley Hultquist, a graduate student in NSE; Jiangtao Zhao, of the European Synchrotron; and Andrea Resta, of Synchrotron SOLEIL. The research was published Tuesday by the journal Scripta Materiala.

“Only with this technique can we measure strain with a nanoscale resolution during corrosion processes. Our goal is to bring such novel ideas to the nuclear science community while using synchrotrons both as an X-ray probe and radiation source,” adds Simonne.

Real-time imaging

Studying real-time failure of materials used in advanced nuclear reactors has long been a goal of Jossou’s research group.

Usually, researchers can only learn about such material failures after the fact, by removing the material from its environment and imaging it with a high-resolution instrument.

“We are interested in watching the process as it happens. If we can do that, we can follow the material from beginning to end and see when and how it fails. That helps us understand a material much better,” he says.

They simulate the process by firing an extremely focused X-ray beam at a sample to mimic the environment inside a nuclear reactor. The researchers must use a special type of high-intensity X-ray, which is only found in a handful of experimental facilities worldwide.

For these experiments they studied nickel, a material incorporated into alloys that are commonly used in advanced nuclear reactors. But before they could start the X-ray equipment, they had to prepare a sample.

To do this, the researchers used a process called solid state dewetting, which involves putting a thin film of the material onto a substrate and heating it to an extremely high temperature in a furnace until it transforms into single crystals.

“We thought making the samples was going to be a walk in the park, but it wasn’t,” Jossou says.

As the nickel heated up, it interacted with the silicon substrate and formed a new chemical compound, essentially derailing the entire experiment. After much trial-and-error, the researchers found that adding a thin layer of silicon dioxide between the nickel and substrate prevented this reaction.

But when crystals formed on top of the buffer layer, they were highly strained. This means the individual atoms had moved slightly to new positions, causing distortions in the crystal structure.

Phase retrieval algorithms can typically recover the 3D size and shape of a crystal in real-time, but if there is too much strain in the material, the algorithms will fail.

However, the team was surprised to find that keeping the X-ray beam trained on the sample for a longer period of time caused the strain to slowly relax, due to the silicon buffer layer. After a few extra minutes of X-rays, the sample was stable enough that they could utilize phase retrieval algorithms to accurately recover the 3D shape and size of the crystal.

“No one had been able to do that before. Now that we can make this crystal, we can image electrochemical processes like corrosion in real time, watching the crystal fail in 3D under conditions that are very similar to inside a nuclear reactor. This has far-reaching impacts,” he says.

They experimented with a different substrate, such as niobium doped strontium titanate, and found that only a silicon dioxide buffered silicon wafer created this unique effect.

An unexpected result

As they fine-tuned the experiment, the researchers discovered something else.

They could also use the X-ray beam to precisely control the amount of strain in the material, which could have implications for the development of microelectronics.

In the microelectronics community, engineers often introduce strain to deform a material’s crystal structure in a way that boosts its electrical or optical properties.

“With our technique, engineers can use X-rays to tune the strain in microelectronics while they are manufacturing them. While this was not our goal with these experiments, it is like getting two results for the price of one,” he adds.

In the future, the researchers want to apply this technique to more complex materials like steel and other metal alloys used in nuclear reactors and aerospace applications. They also want to see how changing the thickness of the silicon dioxide buffer layer impacts their ability to control the strain in a crystal sample.

“This discovery is significant for two reasons. First, it provides fundamental insight into how nanoscale materials respond to radiation — a question of growing importance for energy technologies, microelectronics, and quantum materials. Second, it highlights the critical role of the substrate in strain relaxation, showing that the supporting surface can determine whether particles retain or release strain when exposed to focused X-ray beams,” says Edwin Fohtung, an associate professor at the Rensselaer Polytechnic Institute, who was not involved with this work.

This work was funded, in part, by the MIT Faculty Startup Fund and the U.S. Department of Energy. The sample preparation was carried out, in part, at the MIT.nano facilities.